
Tracking Stress at University Part 2 - A Visual Summary
During my winter break, I contemplated a lot about my previous two semesters at university. I had been stressed constantly and I frequently overworked myself leading to more stress. Before I started Spring 2019, I devised a project that I could use to track and hopefully mitigate my stress while also flexing my data science muscles a bit. In this blog post I made on the first day of the semester, I detailed the variables that I would be tracking and the analyses I thought might be interesting.
However, I believe I might have inadvertantly become a victim of Goodhart’s law, best phrased by Marilyn Strathern: “When a measure becomes a target, it ceases to be a good measure.” Throughout the semester, my stress levels were significantly lower, my classes required less work, and overall, I felt as though I was in a much better place. Now, make no mistake, this is great news for me personally. However, the visualizations aren’t as cool as had hoped.
Either way, here I present the visualizations that I tracked during my semester in order to keep my mental in check.
import datetime as dt
import pytz

import numpy as np
import pandas as pd
import json
from ics import Calendar
from lib.python_fitbit import fitbit
from lib.python_fitbit import gather_keys_oauth2 as Oauth2

import matplotlib.pyplot as plt
from plotly.offline import download_plotlyjs, init_notebook_mode, plot, iplot
import plotly.graph_objs as go
from plotly import tools
import cufflinks as cf
from wordcloud import WordCloud

from lib import custom_utils

init_notebook_mode(connected=True)
cf.set_config_file(world_readable=True, offline=True)
Constants
START_DATE = dt.datetime.strptime('2019-01-22', '%Y-%m-%d')
END_DATE = dt.datetime.strptime('2019-05-10', '%Y-%m-%d')

local = pytz.timezone ("America/New_York")

START_DATE_UTC = local.localize(START_DATE, is_dst=None).astimezone(pytz.utc)
END_DATE_UTC = local.localize(END_DATE, is_dst=None).astimezone(pytz.utc)
Load Daily Log Data
daily_log_df = pd.read_csv('data/Daily Log (Responses) - Form Responses 1.csv', parse_dates=[0, 6])

# get relevant dates
daily_log_df = daily_log_df[(daily_log_df['Timestamp'] > START_DATE) & (daily_log_df['Timestamp'] < END_DATE)]

daily_log_df.head()
| Timestamp | Stress | Happiness | Energy | Motivation | Notes | Date | Food Coma | |
|---|---|---|---|---|---|---|---|---|
| 21 | 2019-01-22 20:07:08 | 2 | 8 | 8 | 8 | First day of classes. I think it's gonna be go... | 2019-01-22 | 1 |
| 22 | 2019-01-23 21:51:14 | 3 | 7 | 8 | 8 | Had all classes now. I'm going to have to work... | 2019-01-23 | 2 |
| 23 | 2019-01-24 20:13:42 | 3 | 7 | 8 | 7 | Everything is still going well for keeping up ... | 2019-01-24 | 1 |
| 24 | 2019-01-25 20:49:29 | 2 | 8 | 7 | 8 | Chilling at the SASA party right now. It's pre... | 2019-01-25 | 1 |
| 25 | 2019-01-26 20:07:14 | 2 | 7 | 7 | 6 | Chilling all day. Went to the gym to start the... | 2019-01-26 | 1 |
Simple Stress Timeseries
stress_trace = go.Scatter(
    x=daily_log_df.Date,
    y=daily_log_df.Stress,
    name='Stress Level',
    fill='tozeroy',
)
data = [stress_trace]
layout = go.Layout(
    title='Stress Level',
    yaxis={
        'title': 'Stress Level',
        'range': [1, 8]


    }
)

fig = go.Figure(data=data, layout=layout)
iplot(fig, filename='stress')
Work
How much does what I need to complete correlate with my stress?
Load Asana Data
asana_df = pd.read_csv('data/asana-umass-s19.csv', parse_dates=[1, 2, 3, 8, 9])
asana_df.head()
| Task ID | Created At | Completed At | Last Modified | Name | Column | Assignee | Assignee Email | Start Date | Due Date | Tags | Notes | Projects | Parent Task | |
|---|---|---|---|---|---|---|---|---|---|---|---|---|---|---|
| 0 | 1120800788569533 | 2019-05-01 | 2019-05-04 | 2019-05-04 | final report | Spanish 306 | NaN | NaN | NaT | 2019-05-04 | NaN | NaN | UMass | NaN |
| 1 | 1120292396473715 | 2019-04-28 | 2019-04-30 | 2019-04-30 | final submission | CS 326 | NaN | NaN | NaT | 2019-04-30 | NaN | NaN | UMass | NaN |
| 2 | 1120002043175716 | 2019-04-25 | 2019-04-25 | 2019-04-25 | go to wikipedia page button | CS 326 | NaN | NaN | NaT | 2019-04-25 | NaN | NaN | UMass | NaN |
| 3 | 884979504873319 | 2019-04-24 | 2019-05-02 | 2019-05-02 | Final cheat sheet | Stats 516 | NaN | NaN | NaT | 2019-05-01 | NaN | NaN | UMass | NaN |
| 4 | 1119773356459372 | 2019-04-23 | 2019-04-30 | 2019-04-30 | hw 5 | CS 589 | NaN | NaN | NaT | 2019-05-02 | NaN | NaN | UMass | NaN |
Due Dates vs Stress
due_date_val_counts = asana_df['Due Date'].value_counts()

due_date_freqs = []
for i in range((END_DATE - START_DATE).days + 1):
    date_str = (START_DATE + dt.timedelta(days=i)).strftime('%Y-%m-%d')
    date_val = due_date_val_counts.get(date_str, 0)
    num = date_val.values[0] if len(date_val)>0 else 0
    due_date_freqs.append({
        'date': date_str,
        'num': num
    })
due_date_freqs_df = pd.DataFrame(due_date_freqs)
due_date_trace = go.Bar(
    x=due_date_freqs_df.date,
    y=due_date_freqs_df.num,
    name='Due Dates',
    yaxis='y2'
)

data = [stress_trace, due_date_trace]
layout = go.Layout(
    title='Stress Level vs Number of Due Dates',
    yaxis1=dict(
        title='Stress Level',
        overlaying='y2',
        range=[0, 8]
    ),
    yaxis2=dict(
        title='Due Dates',
        side='right',
        range=[0, 8]
    ),
)

fig = go.Figure(data=data, layout=layout)
iplot(fig, filename='stress-vs-due-dates')
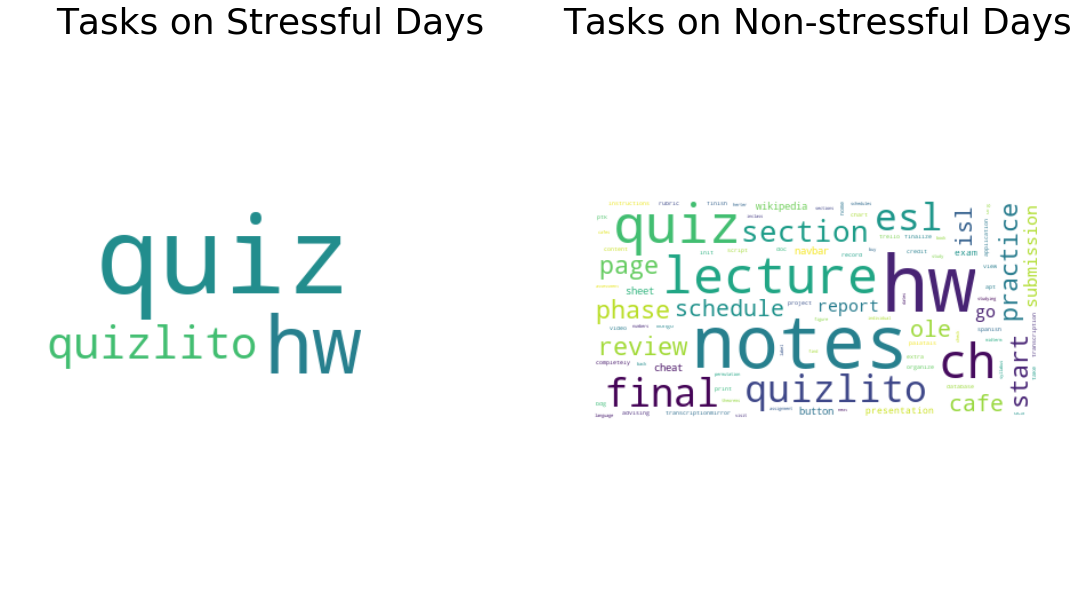
Wordcloud of Due Dates on Stressful vs Non-stressful Days
stressful_dates = daily_log_df[daily_log_df.Stress > 3].Date
nonstressful_dates = daily_log_df[daily_log_df.Stress <= 3].Date
stress_tasks = asana_df[asana_df['Due Date'].isin(stressful_dates)]
nonstress_tasks = asana_df[asana_df['Due Date'].isin(nonstressful_dates)]
# concatenate all name fields from tasks separated by duration of 3 days
stress_text = ' '.join(list(stress_tasks['Name'].dropna()))
nonstress_text = ' '.join(list(nonstress_tasks['Name'].dropna()))

# prep text
stress_wordcloud = custom_utils.generate_wordcloud(stress_text)
nonstress_wordcloud = custom_utils.generate_wordcloud(nonstress_text)

# display wordclouds using matplotlib
f, axes = plt.subplots(1, 2, sharex=True)
f.set_size_inches(18, 10)
axes[0].imshow(stress_wordcloud, interpolation="bilinear")
axes[0].set_title('Tasks on Stressful Days', fontsize=36)
axes[0].axis("off")
axes[1].imshow(nonstress_wordcloud, interpolation="bilinear")
axes[1].set_title('Tasks on Non-stressful Days', fontsize=36)
axes[1].axis("off")
(-0.5, 399.5, 199.5, -0.5)
Number of Incomplete Tasks vs Stress
incomplete_task_counts = []
for i in range((END_DATE - START_DATE).days + 1):
    date = START_DATE + dt.timedelta(days=i)
    incomplete_task_counts.append({
        'date': date,
        'num': len(asana_df[(asana_df['Created At'] <= date) & ((asana_df['Completed At'] >= date) | (asana_df['Completed At'].isnull()))].index)
    })
incomplete_task_counts = pd.DataFrame(incomplete_task_counts)
incomplete_tasks_trace = go.Bar(
    x=incomplete_task_counts.date,
    y=incomplete_task_counts.num,
    name='Incomplete Tasks',
    yaxis='y2'
)

data = [stress_trace, incomplete_tasks_trace]
layout = go.Layout(
    title='Stress Level vs Number of Incomplete Tasks',
    yaxis1=dict(
        title='Stress Level',
        overlaying='y2',
        range=[0, 8]
    ),
    yaxis2=dict(
        title='Incomplete Tasks',
        side='right',
        range=[0, 16]
    ),
)

fig = go.Figure(data=data, layout=layout)
iplot(fig, filename='rhr-vs-due-dates')
Exams vs Stress
with open('data/Exams_2alvmakoou6sa9ks0roaq79nic@group.calendar.google.com.ics', 'r') as f:
    exams_cal = Calendar(f.readlines())
exam_counts = []
for i in range((END_DATE_UTC - START_DATE_UTC).days + 1):
    date = START_DATE_UTC + dt.timedelta(days=i)
    num = 0
    for event in exams_cal.events:
        if (event.begin - date).days == 0:
            num += 1

    exam_counts.append({
        'date': date.strftime('%Y-%m-%d'),
        'num': num
    })

exam_counts = pd.DataFrame(exam_counts)
exams_trace = go.Bar(
    x=exam_counts.date,
    y=exam_counts.num,
    name='Exams',
    yaxis='y2'
)

data = [stress_trace, exams_trace]
layout = go.Layout(
    title='Stress Level vs Exams',
    yaxis1=dict(
        title='Stress Level',
        range=[0, 8]
    ),
    yaxis2=dict(
        title='Exams',
        overlaying='y',
        side='right',
        range=[0, 2]
    ),
)

fig = go.Figure(data=data, layout=layout)
iplot(fig, filename='stress-vs-exams')
Body
How does my body respond to stress?
Setup Fitbit API Client
with open('keys.json', 'r') as f:
    keys = json.loads(f.read())

server = Oauth2.OAuth2Server(keys['fitbit_client_id'], keys['fitbit_client_secret'])
server.browser_authorize()
ACCESS_TOKEN = str(server.fitbit.client.session.token['access_token'])
REFRESH_TOKEN = str(server.fitbit.client.session.token['refresh_token'])
fitbit_client = fitbit.Fitbit(keys['fitbit_client_id'], keys['fitbit_client_secret'], oauth2=True, access_token=ACCESS_TOKEN, refresh_token=REFRESH_TOKEN)
[12/Jun/2019:19:22:39] ENGINE Listening for SIGTERM.
[12/Jun/2019:19:22:39] ENGINE Listening for SIGHUP.
[12/Jun/2019:19:22:39] ENGINE Listening for SIGUSR1.
[12/Jun/2019:19:22:39] ENGINE Bus STARTING
CherryPy Checker:
The Application mounted at '' has an empty config.

[12/Jun/2019:19:22:39] ENGINE Started monitor thread 'Autoreloader'.
[12/Jun/2019:19:22:39] ENGINE Serving on http://127.0.0.1:8080
[12/Jun/2019:19:22:39] ENGINE Bus STARTED


127.0.0.1 - - [12/Jun/2019:19:22:41] "GET /?code=6ca26bec02cd3e194d7a3d292acd43579d406bdf&state=yWAKtBkwQV1kPMpOPi1dePViirgWh3 HTTP/1.1" 200 122 "" "Mozilla/5.0 (X11; Linux x86_64) AppleWebKit/537.36 (KHTML, like Gecko) Ubuntu Chromium/74.0.3729.169 Chrome/74.0.3729.169 Safari/537.36"


[12/Jun/2019:19:22:42] ENGINE Bus STOPPING
[12/Jun/2019:19:22:47] ENGINE HTTP Server cherrypy._cpwsgi_server.CPWSGIServer(('127.0.0.1', 8080)) shut down
[12/Jun/2019:19:22:47] ENGINE Stopped thread 'Autoreloader'.
[12/Jun/2019:19:22:47] ENGINE Bus STOPPED
[12/Jun/2019:19:22:47] ENGINE Bus EXITING
[12/Jun/2019:19:22:47] ENGINE Bus EXITED
[12/Jun/2019:19:22:47] ENGINE Waiting for child threads to terminate...
Resting Heart Rate vs Stress
heart_ts = fitbit_client.time_series('activities/heart',
                                    base_date=START_DATE.strftime('%Y-%m-%d'),
                                    end_date=END_DATE.strftime('%Y-%m-%d'))

rhr_data = []
for row in heart_ts['activities-heart']:
    try:
        restingHeartRate = row['value']['restingHeartRate']
    except:
        restingHeartRate = restingHeartRate

    rhr_data.append({
        'date': row['dateTime'],
        'rhr': restingHeartRate
    })
rhr_df = pd.DataFrame(rhr_data)
rhr_trace = go.Scatter(
    x=rhr_df.date,
    y=rhr_df.rhr,
    name='Resting Heart Rate',
    yaxis='y2',
    fill='tozeroy',
)
data = [stress_trace, rhr_trace]
layout = go.Layout(
    title='Stress Level vs Resting Heart Rate',
    yaxis=dict(
        title='Stress Level',
        range=[0, 8]
    ),
    yaxis2=dict(
        title='Resting Heart Rate',
        overlaying='y',
        side='right',
        range=[45, 70]
    )
)

fig = go.Figure(data=data, layout=layout)
iplot(fig, filename='stress-vs-rhr')
Sleep vs Stress
The missing data in mid-May is because my Fitbit ran out of battery over spring break and I forgot to bring my charger.
sleep_logs = []
for i in range((END_DATE - START_DATE).days + 1):
    try:
        date_str = (START_DATE + dt.timedelta(days=i))
        sleep_log = fitbit_client.get_sleep(date=date_str)
        sleep_logs.append({
            'date': date_str,
            'deep': sleep_log['summary']['stages']['deep'] / 60,
            'light': sleep_log['summary']['stages']['light']  / 60,
            'rem': sleep_log['summary']['stages']['rem']  / 60,
            'wake': sleep_log['summary']['stages']['wake']  / 60,
            'total': sleep_log['summary']['totalMinutesAsleep'] / 60
        })
    except Exception as e:
        print(e)
sleep_df = pd.DataFrame(sleep_logs)
'stages'
'stages'
'stages'
'stages'
'stages'
'stages'
'stages'
sleep_trace = go.Bar(
    x=sleep_df.date,
    y=sleep_df.total,
    name='Sleep',
    yaxis='y2'
)

data = [stress_trace, sleep_trace]
layout = go.Layout(
    title='Stress Level vs Sleep',
    barmode='stack',
    yaxis=dict(
        title='Stress Level',
        overlaying='y2',
        range=[0, 8]
    ),
    yaxis2=dict(
        title='Sleep (Hrs)',
        side='right',
        range=[0, 10]
    )
)

fig = go.Figure(data=data, layout=layout)
iplot(fig, filename='stress-vs-sleep')
Sleep Stages before Stressful vs Non-stressful Days
stress_sleep_logs = sleep_df[sleep_df['date'].isin(stressful_dates)]
nonstress_sleep_logs = sleep_df[sleep_df['date'].isin(nonstressful_dates)]

stress_sleep_sums = stress_sleep_logs.sum()
nonstress_sleep_sums = nonstress_sleep_logs.sum()
fig = {
    "data": [
        {
            "labels": stress_sleep_sums.keys(),
            "values": stress_sleep_sums.values,
            "domain": {"x": [0, .48]},
            "name": "Stressful Sleep Stages",
            "hoverinfo":"label+percent+name",
            "hole": .4,
            "type": "pie"
        },
        {
            "labels": nonstress_sleep_sums.keys(),
            "values": nonstress_sleep_sums.values,
            "domain": {"x": [.52, 1]},
            "name": "Non-stressful Sleep Stages",
            "hoverinfo":"label+percent+name",
            "hole": .4,
            "type": "pie"
        }
    ],
    "layout": {
        "title": "Sleep Stages before Stressful vs Non-stressful Days",
        "annotations": [
            {
                "font": {
                    "size": 20
                },
                "showarrow": False,
                "text": "Stress",
                "x": 0.20,
                "y": 0.5
            },
            {
                "font": {
                    "size": 20
                },
                "showarrow": False,
                "text": "Non-stress",
                "x": 0.83,
                "y": 0.5
            }
        ]
    }
}
iplot(fig, filename='donut')
Habits
How do my actions change when I’m stressed?
Caloric Intake vs Stress
meal_type = { 1: 'Breakfast', 2: 'Morning Snack', 3: 'Lunch', 4: 'Afternoon Snack', 5: 'Dinner', 7: 'Anytime' }
cals_per_nutrient = { 'carbs': 4, 'fat': 9, 'protein': 4 }
macronutrient_logs = []
for i in range((END_DATE - START_DATE).days + 1):
    date = START_DATE + dt.timedelta(days=i)
    food_log = fitbit_client.foods_log(date=date)
    macronutrient_logs.append({
        'date': date,
        'cals_from_carbs': food_log['summary']['carbs']*cals_per_nutrient['carbs'],
        'cals_from_fat': food_log['summary']['fat']*cals_per_nutrient['fat'],
        'cals_from_protein': food_log['summary']['protein']*cals_per_nutrient['protein'],
        'total_cals': food_log['summary']['calories'],
        'foods_eaten': [item['loggedFood']['name'] for item in food_log['foods']]
    })
macronutrient_df = pd.DataFrame(macronutrient_logs)
cals_trace = go.Bar(
    x=macronutrient_df.date,
    y=macronutrient_df.total_cals,
    name='Calories',
    yaxis='y2'
)

data = [stress_trace, cals_trace]
layout = go.Layout(
    title='Stress Level vs Caloric Intake',
    barmode='stack',
    yaxis=dict(
        title='Stress Level',
        overlaying='y2',
        range=[0, 8]
    ),
    yaxis2=dict(
        title='Calories',
        side='right',
        range=[0, 4000]
    )
)

fig = go.Figure(data=data, layout=layout)
iplot(fig, filename='stacked-bar')
Carbs, Fat, Protein Avg on Stressful vs Non-stressful Days
stress_food_logs = macronutrient_df[macronutrient_df['date'].isin(stressful_dates)]
nonstress_food_logs = macronutrient_df[macronutrient_df['date'].isin(nonstressful_dates)]

stress_food_sums = stress_food_logs.sum()
nonstress_food_sums = nonstress_food_logs.sum()
fig = {
    "data": [
        {
            "labels": stress_food_sums.keys(),
            "values": stress_food_sums.values,
            "domain": {"x": [0, .48]},
            "name": "Stressful Caloric Intake",
            "hoverinfo":"label+percent",
            "hole": .4,
            "type": "pie"
        },
        {
            "labels": nonstress_food_sums.keys(),
            "values": nonstress_food_sums.values,
            "domain": {"x": [.52, 1]},
            "name": "Non-stressful Caloric Intake",
            "hoverinfo":"label+percent",
            "hole": .4,
            "type": "pie"
        }
    ],
    "layout": {
        "title": "Caloric Intake on Stressful vs Non-stressful Days",
        "annotations": [
            {
                "font": {
                    "size": 20
                },
                "showarrow": False,
                "text": "Stress",
                "x": 0.20,
                "y": 0.5
            },
            {
                "font": {
                    "size": 20
                },
                "showarrow": False,
                "text": "Non-stress",
                "x": 0.83,
                "y": 0.5
            }
        ]
    }
}
iplot(fig, filename='donut')
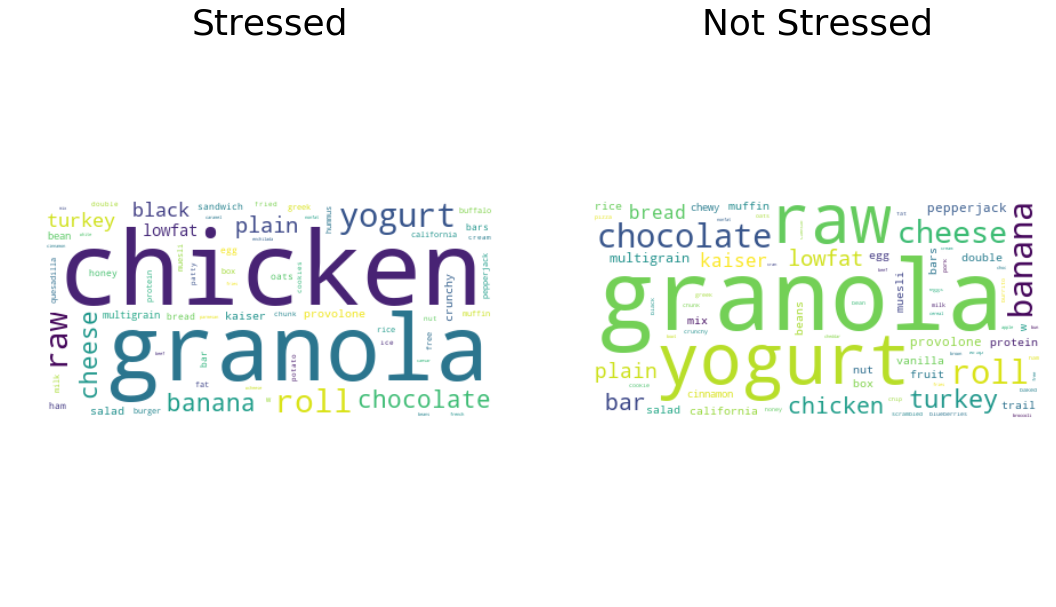
Wordcloud of Foods Eaten on Stressful vs Non-stressful Days
stress_food_str = ' '.join([' '.join(foods_for_day) for foods_for_day in stress_food_logs['foods_eaten'].values])
nonstress_food_str = ' '.join([' '.join(foods_for_day) for foods_for_day in nonstress_food_logs['foods_eaten'].values])
# prep text
stress_wordcloud = custom_utils.generate_wordcloud(stress_food_str)
nonstress_wordcloud = custom_utils.generate_wordcloud(nonstress_food_str)

# display wordclouds using matplotlib
f, axes = plt.subplots(1, 2, sharex=True)
f.set_size_inches(18, 10)
axes[0].imshow(stress_wordcloud, interpolation="bilinear")
axes[0].set_title('Stressed', fontsize=36)
axes[0].axis("off")
axes[1].imshow(nonstress_wordcloud, interpolation="bilinear")
axes[1].set_title('Not Stressed', fontsize=36)
axes[1].axis("off")
(-0.5, 399.5, 199.5, -0.5)
Top 10 Website Usage on Stressful vs Non-stressful Days
webtracker_df = pd.read_csv('data/webtime-tracker.csv', index_col=0).transpose()
webtracker_df.head()
| Domain | 0.0.0.0 | 1.1.1.1 | 127.0.0.1 | 192.168.1.1 | 192.168.123.1 | 2.bp.blogspot.com | 2ality.com | 326webprojectslack.slack.com | 4.bp.blogspot.com | 66.media.tumblr.com | ... | www8.garmin.com | xarray.pydata.org | yalebooks.yale.edu | yourbasic.org | youthful-sage.glitch.me | youtu.be | yutsumura.com | z-table.com | zellwk.com | zulko.github.io |
|---|---|---|---|---|---|---|---|---|---|---|---|---|---|---|---|---|---|---|---|---|---|
| 2018-11-22 | 0 | 0 | 0 | 0 | 0 | 0 | 0 | 0 | 0 | 0 | ... | 0 | 0 | 0 | 0 | 0 | 0 | 0 | 0 | 0 | 0 |
| 2018-11-22.1 | 0 | 0 | 0 | 0 | 0 | 0 | 0 | 0 | 0 | 0 | ... | 0 | 0 | 0 | 0 | 0 | 0 | 0 | 0 | 0 | 0 |
| 2018-11-23 | 0 | 0 | 0 | 0 | 0 | 0 | 0 | 0 | 0 | 0 | ... | 0 | 0 | 0 | 0 | 0 | 0 | 0 | 0 | 0 | 0 |
| 2018-11-24 | 0 | 0 | 0 | 0 | 0 | 0 | 0 | 0 | 0 | 0 | ... | 0 | 0 | 0 | 0 | 0 | 0 | 0 | 0 | 0 | 0 |
| 2018-11-25 | 0 | 0 | 0 | 0 | 0 | 0 | 0 | 0 | 0 | 0 | ... | 0 | 0 | 0 | 0 | 0 | 0 | 0 | 0 | 0 | 0 |
5 rows × 1183 columns
stressful_date_strs = list(stressful_dates.apply(lambda x: x.strftime('%Y-%m-%d')))
nonstressful_date_strs = list(nonstressful_dates.apply(lambda x: x.strftime('%Y-%m-%d')))

stress_domains = webtracker_df.loc[stressful_date_strs].sum(axis=0).sort_values(ascending=False)
nonstress_domains = webtracker_df.loc[nonstressful_date_strs].sum(axis=0).sort_values(ascending=False)
fig = {
    "data": [
        {
            "labels": list(stress_domains[:10].keys()) + ['Other'],
            "values": list(stress_domains[:10].values) + [stress_domains[10:].sum()],
            "domain": {"x": [0, .48]},
            "name": "Stressful Surfing",
            "hoverinfo":"label+percent",
            "hole": .4,
            "type": "pie"
        },
        {
            "labels": list(nonstress_domains[:10].keys()) + ['Other'],
            "values": list(nonstress_domains[:10].values) + [nonstress_domains[10:].sum()],
            "domain": {"x": [.52, 1]},
            "name": "Non-stressful Surfing",
            "hoverinfo":"label+percent",
            "hole": .4,
            "type": "pie"
        }
    ],
    "layout": {
        "title": "Website Usage on Stressful vs Non-stressful Days",
        "annotations": [
            {
                "font": {
                    "size": 20
                },
                "showarrow": False,
                "text": "Stress",
                "x": 0.19,
                "y": 0.5
            },
            {
                "font": {
                    "size": 20
                },
                "showarrow": False,
                "text": "Non-stress",
                "x": 0.85,
                "y": 0.5
            }
        ]
    }
}
iplot(fig, filename='donut')
Stress Level vs Minutes Sedentary
sed_ts = fitbit_client.time_series('activities/minutesSedentary',
                                    base_date=START_DATE.strftime('%Y-%m-%d'),
                                    end_date=END_DATE.strftime('%Y-%m-%d'))

sed_data = []
for row in sed_ts['activities-minutesSedentary']:
    sed_data.append({
        'date': row['dateTime'],
        'rhr': row['value']
    })
sed_df = pd.DataFrame(sed_data)
sedentary_trace = go.Scatter(
    x=sed_df.date,
    y=sed_df.rhr,
    name='Minutes Sedentary',
    yaxis='y2',
    fill='tozeroy',
)
data = [stress_trace, sedentary_trace]
layout = go.Layout(
    title='Stress Level vs Minutes Sedentary',
    yaxis=dict(
        title='Stress Level',
        range=[0, 8]
    ),
    yaxis2=dict(
        title='Minutes Sedentary',
        overlaying='y',
        side='right',s
        range=[0, 1600]
    )
)

fig = go.Figure(data=data, layout=layout)
iplot(fig, filename='stress-vs-min-sedentary')