Basic Algo-Trading Part 1 - Simple Price Prediction using Prophet
The world of trading can be treacherous and practically impossible to keep up with. However, with the recent introduction of commision-free trading platforms like Robinhood, participating in the stock market on a regular basis has become realistic for more people (like me!).
After getting used to the terminology and platform, I realized the potential and power services like Robinhood provide with regards to taking control of your financials. But, there was one problem. I never quite felt like I was making informed decisions. Without confidence in my trades, I felt as though I was gambling, rather than trading.
Since I’m aiming to be a casual trader, I pondered how this could be automated and the most profitable trends found without years of market research or a fancy degree. To my surprise, a potential answer came to my attention through Kaggle’s Data Notes email.
In a post to the S&P 500 stock data dataset on Kaggle, @janiobachmann provides a quick demonstration on how to use Prophet to make stock predictions.
From the Prophet website:
Prophet is a procedure for forecasting time series data based on an additive model where non-linear trends are fit with yearly, weekly, and daily seasonality, plus holiday effects. It works best with time series that have strong seasonal effects and several seasons of historical data. Prophet is robust to missing data and shifts in the trend, and typically handles outliers well.
In this post, I decided to take @janiobachmann’s work one step further by making a queryable algorithm that uses the predictions from Prophet to help inform my trading decisions.
When making the algorithm, I considered the following:
- large brokerages are sometimes literally plugged into Wall Street and they will outtrade you due to their latency advantage
- if a trader wants to execute more than four-day trades in a week, they need at least 25k in their account
- prediction error usually increases exponentially when extrapolating outside of a dataset’s domain
From the first two factors, it’s clear to see that short-range price action prediction has limited viability. Furthermore, long-range also has relatively no probability of being successful. Therefore, my best option is to try my hand at mid-term prediction.
I decided to create a function that takes in the desired ticker, the number of days in the future we want to predict, and a boolean for whether or not we want to see the chart output from Prophet.
The function will return the maximum, average, and minimum expected percent change of the closing price.
Before I ramble any farther, let’s import what we’ll need and create that function!
import pandas as pd
from pandas_datareader import data, wb
import datetime as dt
from fbprophet import Prophet
import matplotlib.dates as mdates
import matplotlib.pyplot as plt

def make_predictions(ticker, daysOut=7, showCharts=False):
    # create start and end dates for stock data query
    start = dt.datetime.now() - dt.timedelta(days=365*5)
    end = dt.datetime.now()

    # get raw open, high, low, close, volume data
    stock_raw = data.DataReader(ticker, 'iex', dt.datetime.now() - dt.timedelta(days=365*5), dt.datetime.now())

    # skip stocks with NaN in history
    if stock_raw.isnull().values.any():
        raise ValueError('Stock data contains null values')

    # get the last close price
    last_close = stock_raw['close'].values[-1]

    # convert datetimes
    stock_raw.reset_index(inplace=True)
    stock_df = stock_raw.copy()
    stock_df.loc[:, 'date'] = pd.to_datetime(stock_raw.loc[:,'date'], format="%Y-%m-%d")

    # prepare data for prophet
    ph_df = stock_df.drop(['open', 'high', 'low', 'volume'], axis=1)
    ph_df.rename(columns={'close': 'y', 'date': 'ds'}, inplace=True)

    # fit data using prophet model
    m = Prophet()
    m.fit(ph_df)

    # create future dates
    future_prices = m.make_future_dataframe(periods=365)

    # predict prices
    forecast = m.predict(future_prices)
    forecast[['ds', 'yhat', 'yhat_lower', 'yhat_upper']].tail()

    # view results
    if showCharts:
        fig = m.plot(forecast)
        ax1 = fig.add_subplot(111)
        ax1.set_title(ticker + " Stock Price Forecast", fontsize=16)
        ax1.set_xlabel("Date", fontsize=12)
        ax1.set_ylabel("Close Price", fontsize=12)

        fig2 = m.plot_components(forecast)
        plt.show()

    # calculate predicted returns
    end_of_period = dt.datetime.now() + dt.timedelta(days=daysOut)

    future_close_max = forecast.loc[forecast.ds > end_of_period].iloc[0].yhat_upper
    future_close_expected = forecast.loc[forecast.ds > end_of_period].iloc[0].yhat
    future_close_min = forecast.loc[forecast.ds > end_of_period].iloc[0].yhat_lower

    # calculate percent changes based on predictions
    max_move = (future_close_max - last_close)/last_close
    expected_move = (future_close_expected - last_close)/last_close
    min_move = (future_close_min - last_close)/last_close

    return (max_move, expected_move, min_move)
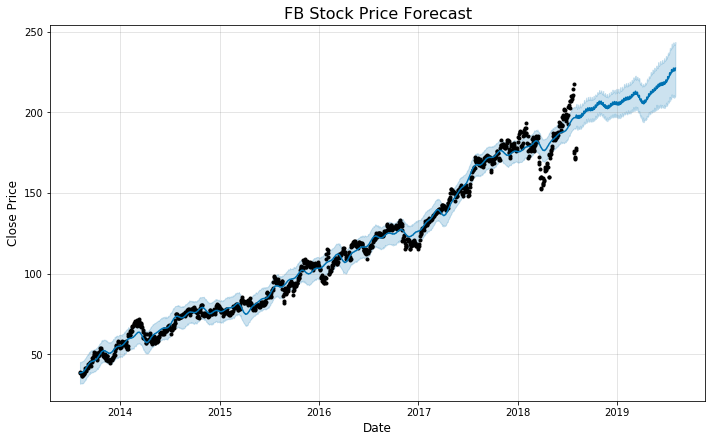
Alright, now let’s test it on a popular stock, like Facebook.
max_move, expected_move, min_move = make_predictions('FB', 7, True)
5y


INFO:fbprophet.forecaster:Disabling daily seasonality. Run prophet with daily_seasonality=True to override this.
/home/sean/.virtualenvs/ml/lib/python3.6/site-packages/pystan/misc.py:399: FutureWarning: Conversion of the second argument of issubdtype from `float` to `np.floating` is deprecated. In future, it will be treated as `np.float64 == np.dtype(float).type`.
  elif np.issubdtype(np.asarray(v).dtype, float):
/home/sean/.virtualenvs/ml/lib/python3.6/site-packages/matplotlib/cbook/deprecation.py:107: MatplotlibDeprecationWarning: Adding an axes using the same arguments as a previous axes currently reuses the earlier instance.  In a future version, a new instance will always be created and returned.  Meanwhile, this warning can be suppressed, and the future behavior ensured, by passing a unique label to each axes instance.
  warnings.warn(message, mplDeprecation, stacklevel=1)
print('Max Move: {0}% \nExpected Move: {1}% \nMin Move: {2}%'.format(round(max_move*100, 2), round(expected_move*100, 2), round(min_move*100, 2)))
Max Move: 14.07%
Expected Move: 10.43%
Min Move: 6.7%
Interpretation
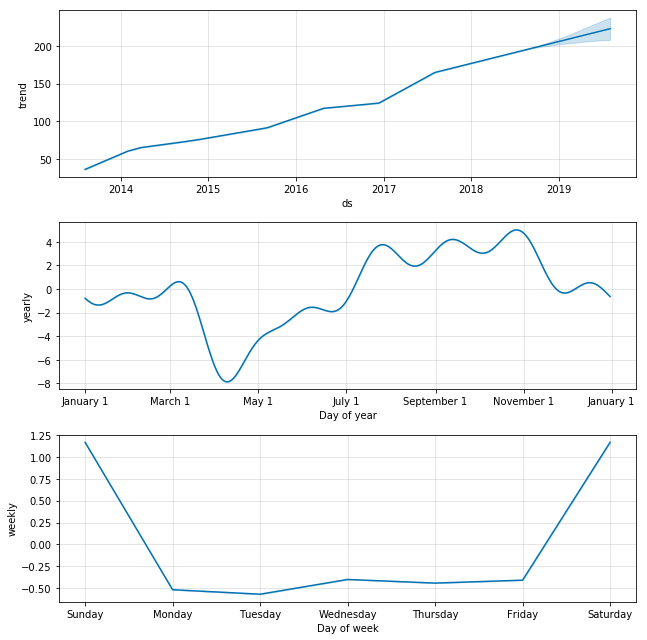
The first graph simply plots the close price predictions made by Prophet. The next three are component plots from Prophet’s predictions. Since Prophet focuses on time-series data with seasonal tendencies, showing components can sometimes lead to further insights into how the data changes.
As briefly explained above, the outputs of the function are the maximum, average, and minimum expected percent change of the closing price over the range we chose.
Conclusion
So far, we’ve created a basic platform for price prediction that has a chance of working with a mid-range strategy. But right now, it doesn’t really do much…
In the next part, I’ll develop a basic strategy and test its performance using backtrading!
Disclaimer
The above references an opinion and is for information purposes only. It is not intended to be investment advice. Seek a duly licensed professional for investment advice.